C-TIP - Total Infected Number Prediction for COVID-19

Jianhong Chen, Sheldon Fries, Wendy Huang, Shanila Javed, James Young
CMPT 340 – G. Hamarneh Department of Computing Science - Simon Fraser University
Abstract
The project focuses on creating estimated numbers of the currently infected, susceptible and recovered cases of COVID-19 using a mathematical epidemic prediction model called the SIR model. This model depends on initial parameters for the susceptible, infected, and recovered cases at time 0, as well as β and γ values which affect the growth rate of these cases. By entering these parameters into the model, we can minimize the distance between the actual cases and projected cases and create a projected number of cases in future dates.
Based on the data that is currently available and the optimization function we have created, we have found that the number of global active (reported) infections should peak at roughly 1.8 million cases. This peak should take place roughly 45 days from the starting date of the model (March 10th, 2020), which would fall on April 24th, 2020. This model does not account for any potential situations where the number of infected cases will peak a second time.
Keywords
COVID-19, SIR, Epidemic Prediction, Disease, Model, Short-term Forecast, Epidemic Control
Introduction
The SIR model is a predictive model for infectious diseases that generates proportions of susceptible, infected, and recovered (or dead) populations given initial parameters. By using data collected on COVID-19, this model can be used to predict the number of people infected with the disease, and to approximate when to expect the peak and end of the pandemic. Altering the initial parameters for the model can also help to predict the effect of mitigation attempts, such as social distancing or quarantine, or the lack thereof. This virus has drastically altered the lives of people around the world, which should make this a topic of much interest.
There are many examples of SIR models for general use (without sample data) as well as for specific viruses such as COVID-19. One such model that exists for COVID-19 is the fitVirusCV19v3 (COVID-19 SIR Model) [1] for MATLAB, which retrieves the latest data, estimates the initial parameters using this data, and then uses both the data and initial parameters to form the SIR model. Other models have focused on specific countries, such as the COVID-19 data with SIR model [2] on Italy and Japan. This model divides the data into "phases" based on measures that were taken by the countries' governments and tweaks the parameters for each phase.
The rest of the report is divided as follows. The 'Materials' section will cover any external data or programs used in creating the model. The 'Methods' section will cover the mathematical formulas, pseudo-code, and explanation of the model. 'Results' will highlight the important findings extracted from the model, while 'Accomplishments' will summarize what we've learned and list the obstacles we encountered as we completed this project. The 'Contributions' section will list what each group member contributed to the project. 'Conclusions and Discussions' will briefly summarize the work performed in this project and offer our analysis of the project. 'Future Work' will highlight any parts of the project that we hoped to include but needed to leave for future iterations, if possible. Finally, the 'References' section lists all of the sources used for this project.
Materials
The data used for this model was collected from Novel Coronavirus (COVID-19) Cases Data [3]. Specifically, the following spreadsheets were used to obtain the number of confirmed and recovered cases, as well as the number of deaths.
- 'time_series_covid19_confirmed_global.csv'
- 'time_series_covid19_recovered_global.csv'
- 'time_series_covid19_deaths_global.csv'
This data was truncated to provide an exact time range for the prediction. This time range spanned from March 10th, 2020 to April 13th, 2020.
The SIR model was created using MATLAB. The above data was also altered within the script for the model.
The global population number used in this model was taken from fitVirusCOVID19 [3].
Methods
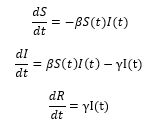
The SIR model has three components: the number of people who are susceptible to the disease (S), the number of people who are infected (I), and the number of people who have recovered from or have succumbed to the disease (R). There are two parameters and γ which reflect the rate of infection and rate of recovery, respectively. The model depends on the following three equations to derive the rate of change for S, I, and R at a given time t:
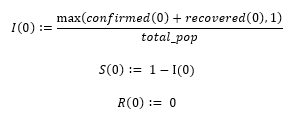
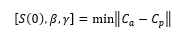
The above equations require initial values for S(0), I(0), and R(0). This model uses the first date in the collected data to determine the necessary initial values. Let confirmed(t) and recovered(t) represent the actual number of confirmed and recovered cases at time t, respectively. Let total_pop represent the total population of the world, or the chosen country. Note that the value for I(0) must be greater than zero for the infection to spread, therefore the value of I(0) is set to '1' for any countries that did not have a confirmed case as of the start date for this model.
The rates of infection and recovery are derived from the reproduction number, or R0.

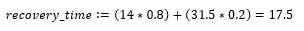
According to the WHO, the value of R0 is believed to be between 2-2.5 [4]. The length of time it takes for a person to recover from COVID-19 depends on the severity of their symptoms and is "approximately 2 weeks" for mild cases and anywhere from 3-6 weeks for severe cases [4]. The WHO suggests that roughly 80% of cases are mild and 20% of cases are severe or critical, therefore the average recovery time can be computed as follows. Let the number of days for mild cases equal 14 (2 weeks), and the number of days for severe cases equal 31.5 (four and a half weeks).
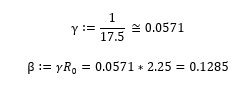
The rate of recovery can be represented as the inverse of the recovery time. The rate of infection can also be derived now that values for R0 and γ are known.
Upon testing, however, we found that these values produced results that were not in line with the actual data to date. In order to find the parameters that would produce the most accurate results, we created a loss function to find the parameters that produced the minimum distance between the actual cases (Ca) and the projected cases (Cp).
We used the following cost function in automating the procedure of testing how well different combination of β and γ. We used the formula:
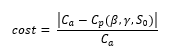
Using a nested for loop we can compare the accuracy of different combination of β and γ and automate the process of optimizing the function based on the data received so far.
Results
With the parameters from the previous section, we can use the model to predict the proportion of the population that will be susceptible, be infected, and have recovered at a given time t. Once we have the proportions, we can multiply them by the total population to translate them into populations.
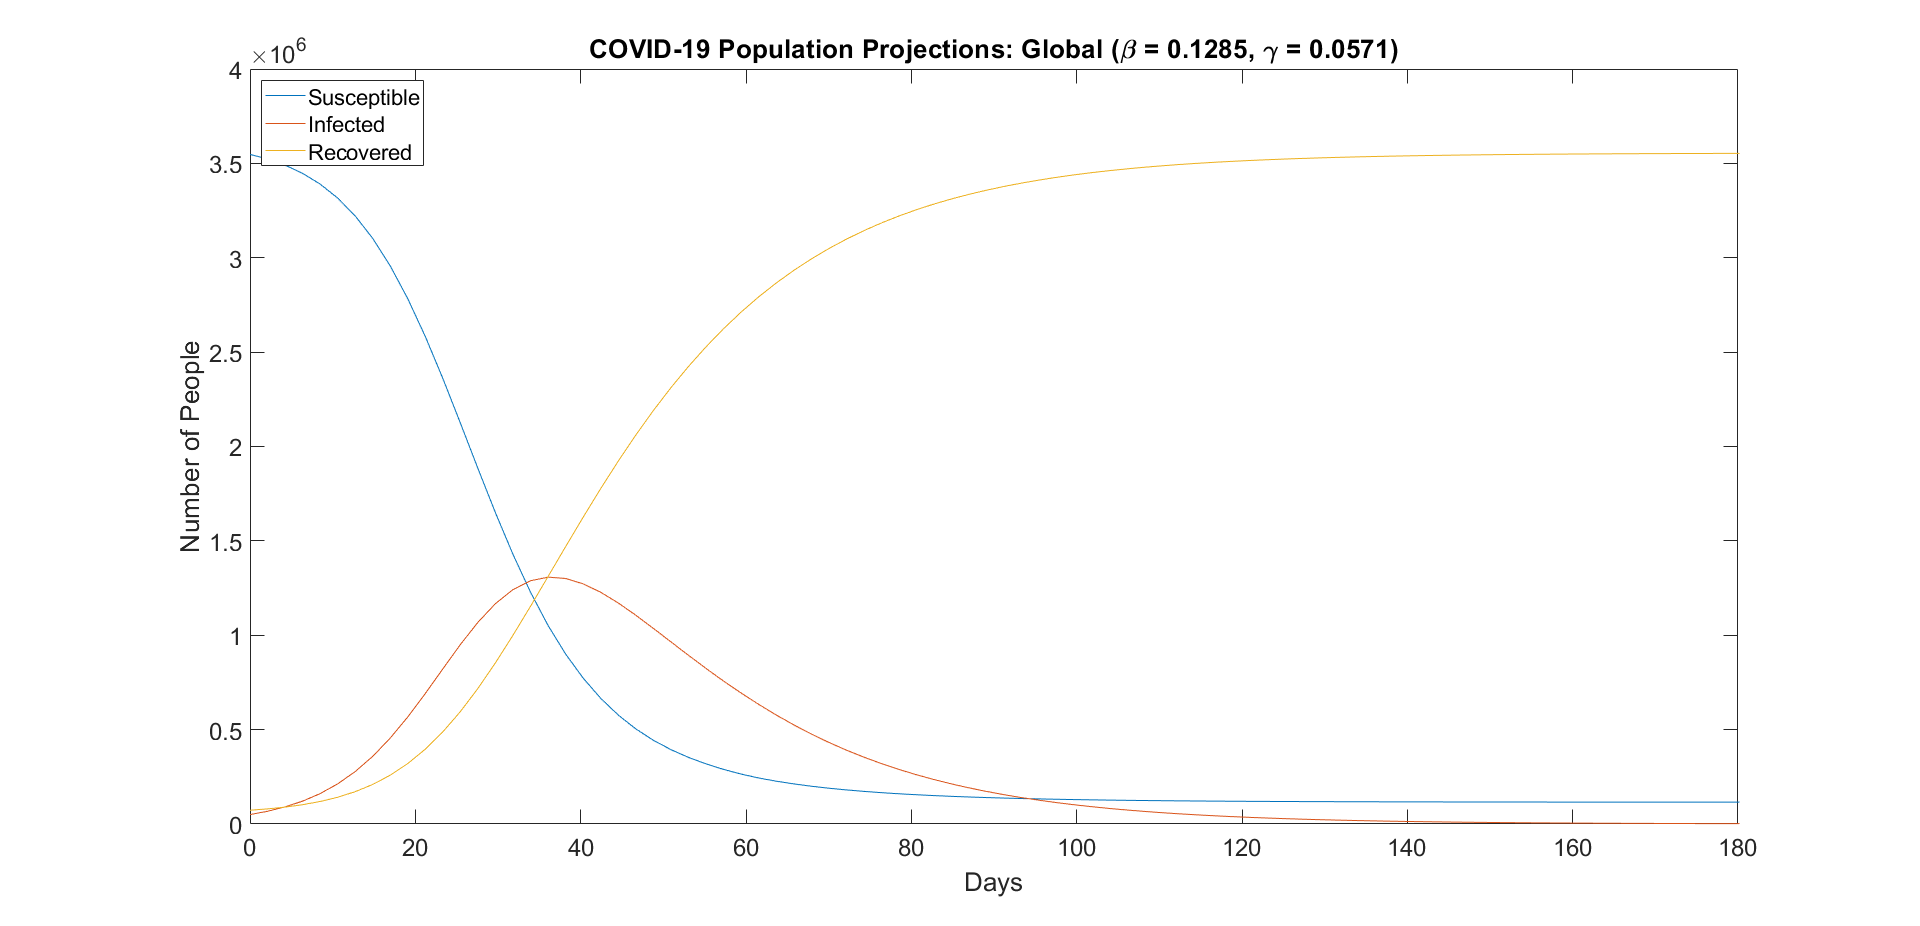
Figure 1: Susceptible, infected, and recovered global population projections.
However, fitting these projections to the actual data shows that the projections underestimate the infected population, and overestimate the recovered population. This can be observed below.
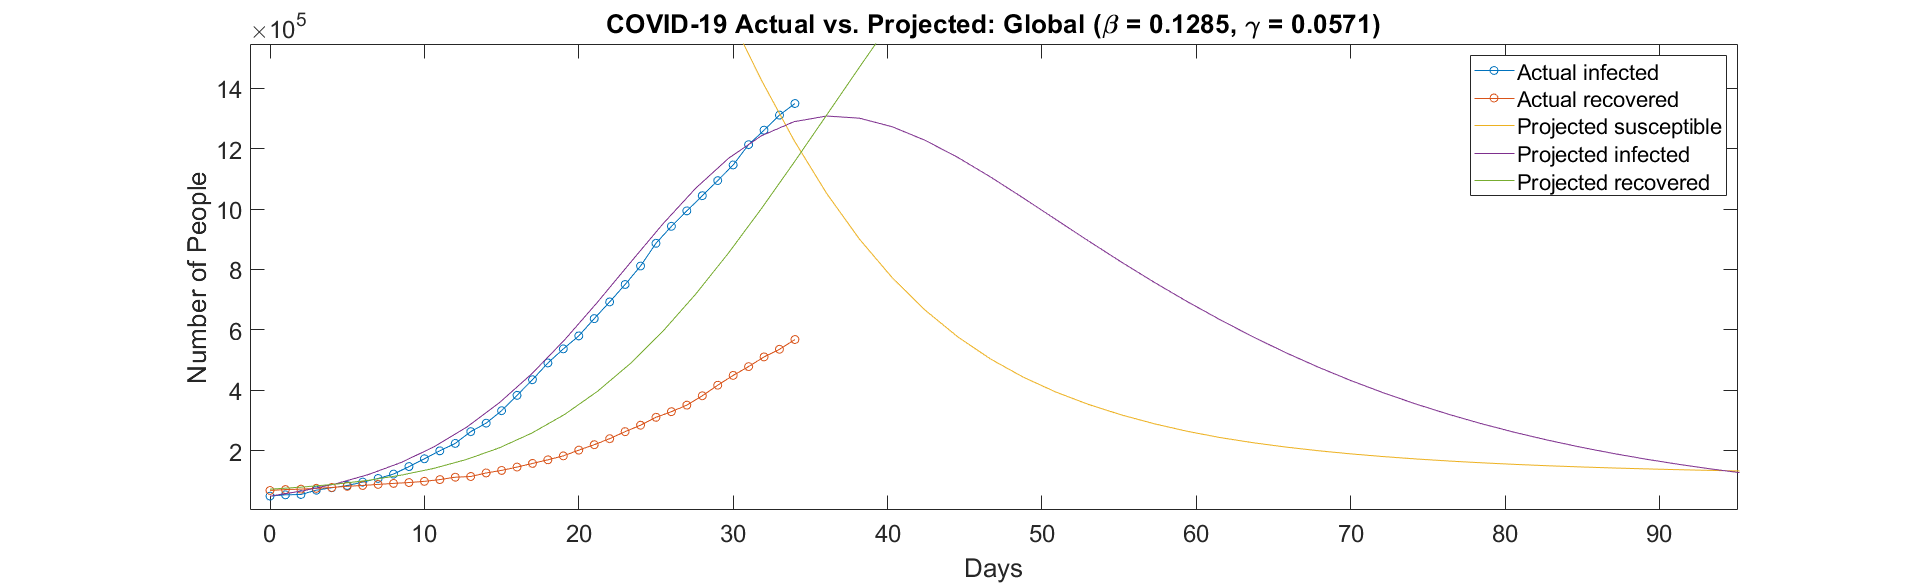
Figure 2: Comparison between the actual and projected populations.
In order to find a more accurate fit for our projections, we need to find the right parameters to enter into the model. We used the optimization function shown in the previous section to accomplish this. After running the optimization function, we found that the best values for β and γ were 0.1 and 0.03, respectively.
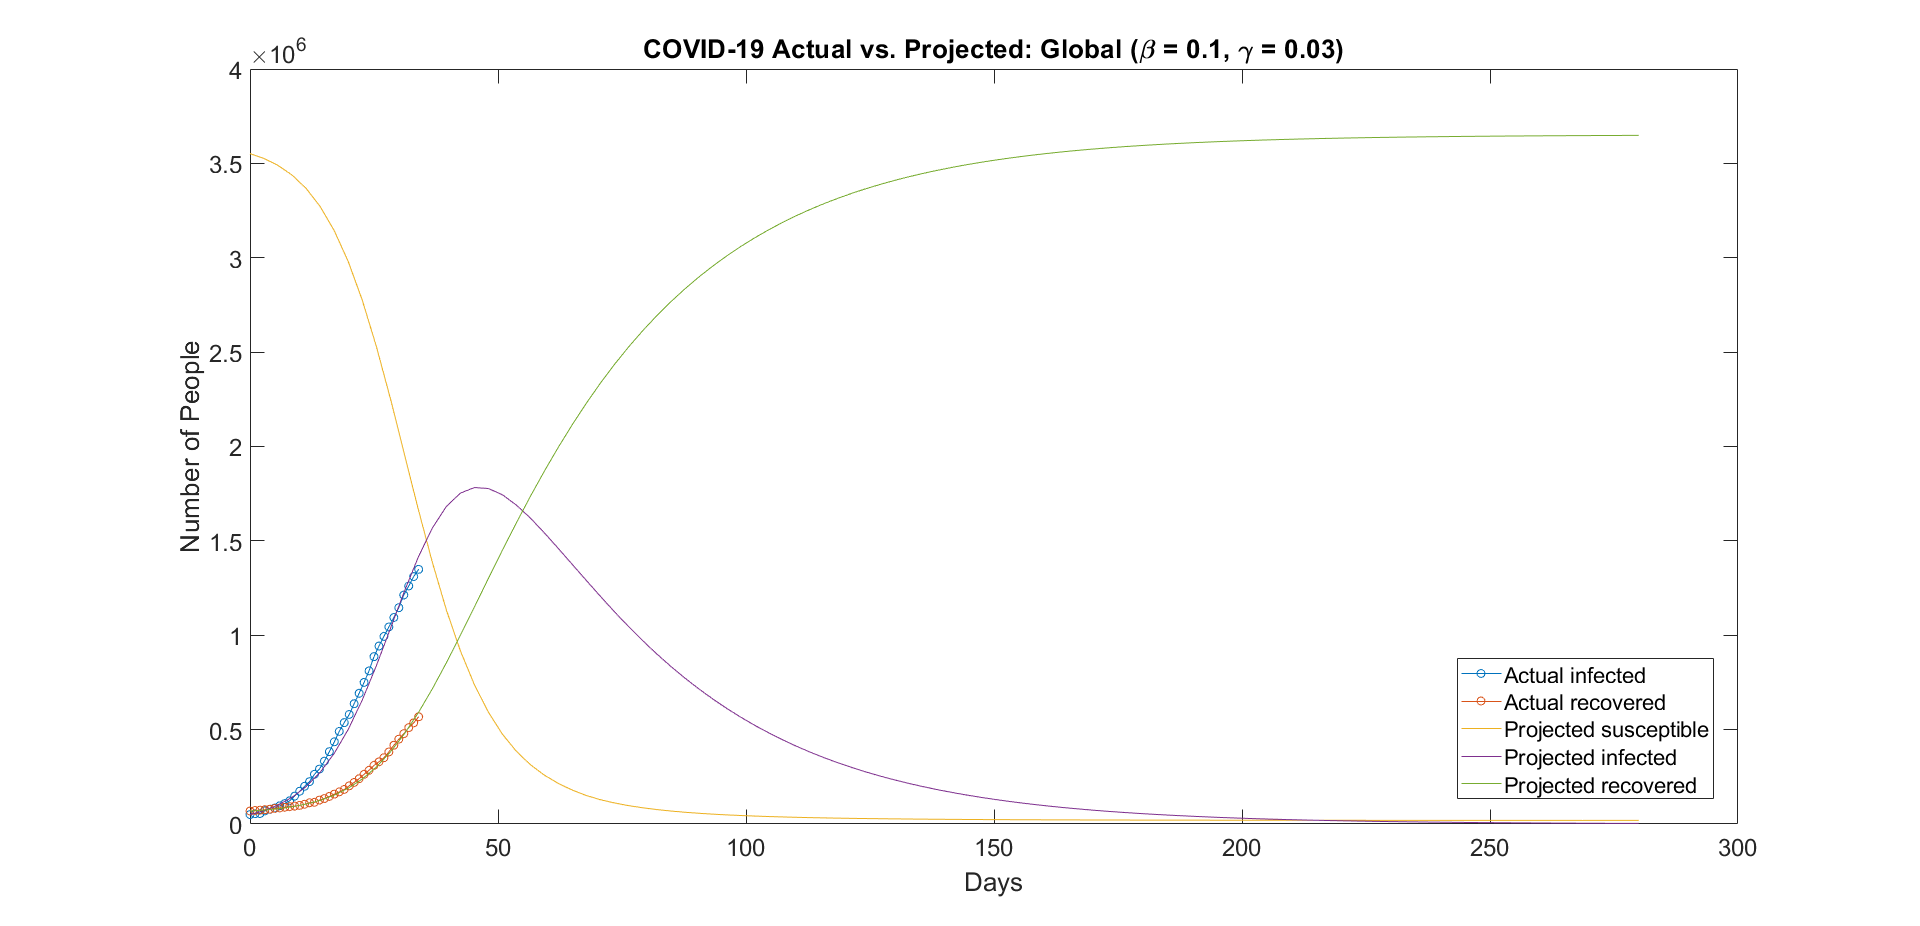
Figure 3: Updated projections using the new beta and gamma values.
Accomplishments
In completing this project, we learned about the factors that affect the spread of diseases such as COVID-19. After learning about the rates of infection and recovery, it was easier to understand what "flattening the curve" meant, and how it would affect the number of infections over a time span. By testing the model with numerous different parameters, we were able to see how mitigation effects such as social distancing could reduce the rate of growth of infections.
One of the biggest obstacles we faced over the course of this project was in finding the correct parameters for the model. Finding the right parameters to fit the projected cases as closely as possible to the actual cases took far longer than we had initially expected. We struggled with developing the optimization function that would produce the best parameters and could not find parameters from other sources that would work with our model. We eventually managed to complete the optimization function which allowed us to find the parameters we needed for an accurate projection, but we found that the population numbers needed further tweaking. As mentioned earlier, we used the global population number from the fitVirusCOVID19 model and found that it worked well with our model.
We had to dig into lots of problems with how MATLAB solves the differential equations, initially the idea is to symbolize all the calculation steps for the cost function and finding the local minima using MATLAB function fminsearch. However, we underestimate the difficulty of doing so and could not find the exact MATLAB function to use for symbolic differential equation solver that suit our purpose. Then we decide to switch to stick with the vector calculations.
The problem with the vector calculation is the MATLAB differential equation solver does not return consistent length vector when changing the parameter and the actual infection, recovered number we got from the data set is recorded per day. To tackle this, we end up constructing the cost function based on the actual number from the data set and for each entry find the prediction that has the closest value to each day and compare the difference of their number of infection and recovered.
For (each_day){

prediction_index = minimum ( abs(prediction_time – each_day) );

cost += abs(actual_data(eachday) – prediction_data(prediction_index) );

}
Using the above function, we were able to find the gather the cost of our guesses. But when we check on the output again, we found there the prediction would be close to the infection but far away from recovered. This is because on the data sets, we have, the actual infections are way larger than the infection numbers, so the cost we get is biased or weighted on having a better fit on the infection than the recovered. After realizing the problem, we decide to use the relative cost which would take the difference and divide by the size of actual infected and recovered to provide equal weight for both predictions. And thus, we were able to get much accurate predictions.
Contributions
The following is a list of contributions by each group member.
- Jianhong Chen
- I received the MATLAB code in generating the SIR curve and perform differential equations from Sheldon and designed the ways to compare and construct the cost function in order to produce an SIR curve that matches original datasets. I used some parameters that is generated through optimization in fitVirusCV19v3[1] to start with the work and explores the effect of different parameters on the fitting of the prediction.
- Sheldon Fries
- Created the initial script for the SIR model and handled the importing and modification of the collected data.
- Combined code received from Jianhong with my own, and cleaned up the code to improve its readability.
- Wendy Huang
- Identified available datasets that are appropriate for the project
- Researched suitable models and chose the SIR model for the project
- James Young
- Researched machine learning and neural network architectures to apply to SIR Model
- Tested and verified SIR Model and parameters worked correctly
Conclusions and Discussions
After creating the SIR model in MATLAB, we attempted to create projections by calculating the rates of infection and recovery and deriving the parameters from these rates. The resulting projections were not accurate enough, therefore we looked to create an optimization function that would provide us with more accurate parameters. The optimization function produced parameters that in turn produced a much more accurate projection, allowing us to chart the potential peak of the virus. According to our projections, the peak will likely take place around April 24th, 2020 and will see a total number of infections at roughly 1.8 million.
Although the prediction model and the assumptions are very basic and lack of consideration of real-life situations the prediction its making are meaningful in a way of providing an idea of the size of the epidemic. The accuracy of such basic model is somewhat surprising. Using the data until April 13th, the prediction shows the on the 17th the total infection number is 1,504,000 and the total recover plus death 732,500, and the actual numbers from the 17th are 1,530,689(+1.7%) and 727,769(+0.6%) compared to the prediction using such model.
Given the security concerns of different countries, the rapid spread of the disease, the long incubation period, and other various reasons, it is difficult to validate the accuracy and reliability of the numbers shown in our data. Furthermore, it has also come across our attention that some recovered patients with COVID-19 were again tested positive, according to a recent CNN report [5]. There are also possibilities that recovered people could lose their immunity over a certain period. However, the above constructed SIR model assumes absolute immunity after a person is recovered from the disease. Given that COVID-19's rate of reinfection is not yet confirmed, the above model is only a naïve prediction based on the information that is currently available.
Future Work
To obtain the most accurate short-term prediction, the parameters and inputs of the above model are required to be closely up to date. Thus, we will be monitoring the latest news about COVID-19 and adjust the model accordingly. We began researching about neural network architecture and testing various machine learning techniques to try testing the data on our model, however more time and dedicated resources would be needed to be able to look into applying deep learning technology in training a neural network to simulate the spread of the disease.
Additionally, we would like to investigate the correct parameters for individual countries rather than just for global data. The model is currently built to support the use of country data, but we lack the necessary parameters to create accurate predictions at the country level. By comparing the projections for individual countries against one another, we can potentially learn how each country has been at mitigating the spread of COVID-19. Some countries opted for swift and strict measures in the hopes of flattening the curve early, while other countries waited for the virus to spread within their borders before enacting measures such as social distancing. It would be interesting to compare the results and projections of these countries to learn more about the effectiveness of mitigation techniques.
References
- fitVirusCV19v3 (COVID-19 SIR Model). (n.d.). Retrieved April 1, 2020, from https://www.mathworks.com/matlabcentral/fileexchange/74676-fitviruscv19v3-covid-19-sir-model
- Lisphilar. (2020, April 20). COVID-19 data with SIR model. Retrieved April 19, 2020, from https://www.kaggle.com/lisphilar/covid-19-data-with-sir-model
- Novel Coronavirus (COVID-19) Cases Data - Humanitarian … (n.d.). Retrieved March 29, 2020, from https://data.humdata.org/dataset/novel-coronavirus-2019-ncov-cases
- fitVirusCOVID19. (n.d.). Retrieved April 17, 2020, from https://www.mathworks.com/matlabcentral/fileexchange/74658-fitviruscovid19
- Report of the WHO-China Joint Mission on Coronavirus Disease 2019 (COVID-19) (n.d.). Retrieved April 19, 2020, fromhttps://www.who.int/docs/default-source/coronaviruse/who-china-joint-mission-on-covid-19-final-report.pdf
- Hancocks, P., Seo, Y., Hollingsworth, Julia. Recovered coronavirus patients are testing positive again. Can you get reinfected? CNN Health. Retrieved April 19, 2020, from https://www.cnn.com/2020/04/17/health/south-korea-coronavirus-retesting-positive-intl-hnk/index.html